Power BI report templates
The Microsoft Power BI report templates are ready-to-use reports that you can use immediately or customize to create your own reports to suit your needs.
We recommend using the Power BI service included with paid subscriptions to Power BI Pro and above. This service allows, among other things, to update the dataset of reports regularly, e.g. once a day during the night hours, when a slight slowdown of applications due to data updates affects only a minimum of users. The display of the reports itself no longer slows down the response of the applications, because only the data from the updated dataset is used.
For more information on Power BI, tutorials and courses, please see the Power BI documentation.
Note:
Alternatively, you can also view the reports in the free
Power BI Desktop application. In order to ensure that updating the dataset during normal business hours does not slow down the response of Alvao applications, we recommend using
analytic database to update the dataset.
Installation
- Download the report template from ALVAO Download.
- Install the Power BI Desktop application and open the report template.
- View the contents of the report based on the prepared model data.
- Connect the assembly to your Alvao database:
- On the Home tab, use the Transform Data command.
- In the Queries column, enter parameter values:
- SqlServer - enter the name of your SQL Server.
- Database - enter the name of your database.
- HistoryMonths - optionally change the length of the request log history in months to be loaded into the report. Older records are not loaded into the report. The larger the value you specify, the longer it will take to update the dataset and the larger the size of the dataset.
- Save the settings using the Close and Apply command.
- Enter name and password to connect to the database.
The user account used must have at least the SELECT right in the database schema Query.
This will simply ensure, for example, the db_datareader role throughout the database.
Only information that the used Alvao account has access to is read from the database into the dataset, see:
- Asset Management - permissions to read objects and property-values;
- Service Desk - permissions to view requests, i.e. the role Reader in the given services;
- Service Desk - permissions to read information about people and organizations, i.e. membership in the group Contact readers or Contact administrators.
- Wait for the data to be loaded into the report.
- Upload the report to a workspace in Power BI Service using the Publish command.
- In the dataset settings, turn on regular updates every day at night.
- Click on a report to view that report.
Tip:
You can customize the range of the displayed data by using the filters, which can always be found at the right edge of the report.
Tip:
Share the report with other users who have a Power BI Pro license or higher.
Tip:
You can create your own reports based on the datasets created from the report templates in Power BI service. This way, the datasets will be shared and will only be updated once for a given report.
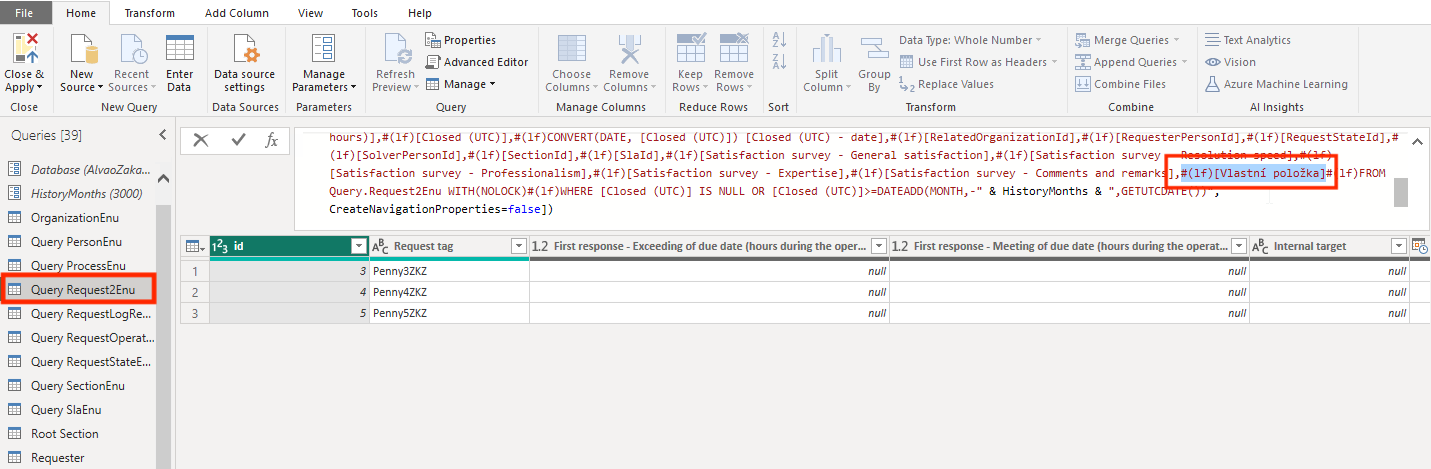
Displaying request custom fields
You can add your request custom fields to the report with these steps:
- On the Home tab, use the Transfrom data command.
- In the Queries column, open the Request2Enu Query.
- Enter the required custom fields to the right place in the query.
Alvao Analysis
This report contains a set of pages with basic overviews of services, requests and facilities in Alvao.
The template for this report is stored in the file AlvaoAnalysis.pbix.
The first pages of the report relate to the ALVAO Service Desk product. These are followed by pages for ALVAO Asset Management:
- Requests on objects - at the top of the page you can see the objects in the graph that have the highest number of requests linked to them in ALVAO Service Desk. Select an object in the graph and the corresponding requests will be displayed at the bottom.
- Objects - at the top of the page, you can see the number of objects by manufacturer, object type and device model in the graphs. Select a value with the mouse and details of the corresponding objects are displayed at the bottom of the page.
- Computers - at the top of the page, you can see the number of computers by manufacturer, type of computer (e.g. desktop, laptop, ...) and operating system in graphs. Select a value with the mouse and the bottom of the page shows details of the corresponding computers.
- Object age - at the top of the page, you can see a graph showing the number of objects by their age in years, with a color breakdown by object type. Select any value in the chart and the corresponding objects will be displayed at the bottom of the page.
- Installed software - at the top of the page you can see the numbers of software installed on computers in graphs by publisher and product. Select a value and at the bottom of the page you will see details of the computer on which the software is installed.
Each user in the report can only see the objects and requests that they are allowed to see in Alvao.
The assembly is available in English only.
Did not find what you were looking for? Ask our technical support team.